This is the Sponsored paywall logged out
Ofwat has asked water companies to cut leakage by 17 per cent by 2025 and UKWIR wants zero leaks by 2050. Can the Netherlands, with its 5 per cent rate of leakage, offer any pointers on how this can be achieved?
Leakage is a constant problem for the industry, annually generating eye-watering statistics that reveal the extent of the water escaping pipes every day. This poses a particular issue when customers hear about the amount of water lost at the same time as their water supplier is reminding them of the importance of sustainability and conscientious usage.
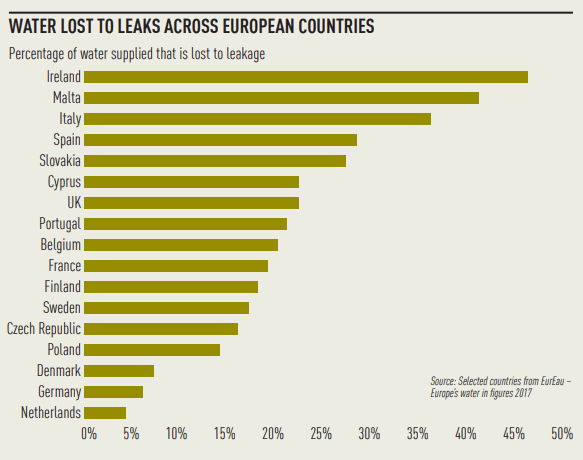
Despite its necessity, sustainability is a hard message to subscribe to on a personal level when it appears that leakage on an industrial level sees scant improvement year on year. In 2017/18, about 23 per cent of the UK’s water was lost to leakage. This meant the UK was below average among European countries, sitting roughly equal with the leakage rates of Cyprus – although well ahead of worst-performing Ireland, which lost nearly half of its water through leaks.
UK Water Industry Research (UKWIR) has set the UK’s water sector a goal of zero leaks by 2050. The research group’s chief executive, Steve Kaye, has said the industry needs to look to countries such as the Netherlands, which consistently boasts a leakage rate of a mere 5 per cent, to see what can be learned from how things are done there.
Minor improvement
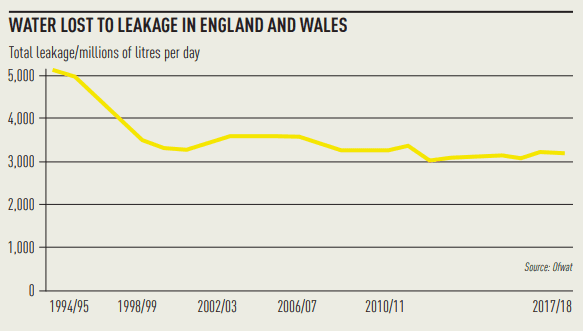
Between April 2018 and March 2019, 3,170 million litres of water leaked every day –equivalent to 1,268 Olympic swimming pools. This figure has remained reasonably consistent since 2012, hovering just above the 3,000 million litre figure. Prior to this, the peak for leakage occurred in 1994/95, the first year in which reliable figures were available, according to Ofwat, when 5,112 million litres were lost each day. These figures dropped considerably over the next five years to the mid-3,000 millions, before remaining reasonably steady for the duration of the first decade of the millennium.
All this means that in the past 15 to 20 years, while a greater and greater impetus has been placed on conserving water and increasing the sustainability of the water system, leakage has only seen a minor improvement considering the attention it draws and the lengths to which companies go to express how seriously they take the issue.
This does not bode well for the increasing pressure on water suppliers from regulator Ofwat to cut leakage year on year.
Updated figures from Discover Water showed usage in England and Wales rose last year to 143 litres used by each person per day. On the plus side, this data also indicated that 11 of the 16 companies that set a leakage target for 2018/19 exceeded their goal, compared with seven companies in 2017/18.
Water company trade body Water UK has stressed there is still more work to do to meet the industry-wide reduction by 2025. This figure was raised from 16 to 17 per cent by Ofwat in its recent draft determinations.
Dutch performance
Ralph Beuken, a scientific researcher at water research institute KWR, based in Nieuwegein in the Netherlands, was one of the main authors of a paper published in 2008 in response to a previous report from Ofwat comparing the performance of UK water companies to their European counterparts. In this report, Dutch leakage figures were described as “suspiciously low”. This statement prompted Beuken’s paper, which sought to prove that the data on the Netherlands was in fact correct.
Beuken explains the research and points out there is a collection of factors that combine to cause the extremely low rates of leakage seen in the Netherlands. These include:
- The majority of the Dutch network was laid after 1950, with the most common material used being PVC pipes, followed by asbestos-cement and cast iron.
- Most of the mains are along footpaths, with loose block paving on the surface, meaning leaks become readily visible.
- There is a variety of soil types, such as sand and clay, which contain few stones. Furthermore, pipes are laid along levelled sand beds, which are then backfilled with soil.
- The Netherlands is relatively flat, meaning the distribution system can operate at lower pressures than in the UK, where higher pressures are needed to supply higher-altitude regions.
- Most areas have 100 per cent metering of customers, whereas the UK has yet to adopt wholesale household metering in the water sector.
On the face of it, most of these causes appear to be things that cannot be simply replicated in the UK. Naturally, our soil and topography cannot be altered and the whole mains system cannot be rejuvenated overnight.
Public spirited
Beuken points to the fact that Dutch utilities are publicly owned as a potential reason why they are so keen to plug any and all leaks. He says companies “take asset management very seriously” and “if a leak is reported, it is repaired”.
The notion of a more effective public system plays into the hands of Jeremy Corbyn’s election promises, but the UK’s historical public water system did not mirror this. The first reliable leakage figures come from 1994/95, five years after privatisation, and have dropped 38 per cent as private ownership has continued.
The Dutch approach to leaks differs; in the UK, companies follow an approach called the sustainable economic level of leakage. Under this, Ofwat only requires water companies to stop leaks if the saving made by fixing the leak is greater than the cost to perform the maintenance. Conversely, “it’s never the idea that it’s just a small leak, no problem at all”, for the Dutch, says Beuken. “It’s not a matter of balancing costs.”
Leak detection analysis in the Netherlands
In order to verify the Netherlands’ low figures, two research teams, one from the Netherlands and one from the UK, were formed with the aim of exchanging information regarding leakage and identifying the major factors causing leakage to occur.
As part of this exchange, both teams performed leak detection analysis at a handful of sites in the Netherlands. Experienced British leak detectors examined 19km of distribution mains belonging to Dunea, a Dutch utility, that were identified as having a relatively high burst risk. In total, two minor leaks were found with a volume of roughly 0.4m3/hour.
Within 16km of mains belonging to Oasen, another company, only one leak was found, and at Waternet, the final company, 8km of mains had no signs of leakage detected. This gave a total of 43km of mains examined, with only three leaks found with a total volume of 1m3/hour.
Compounding these discoveries, the Dutch teams performed system-wide calculations to determine the amount of leakage in two different areas of the Netherlands. The first occurred in Benthuizen, a village with a population of approximately 3,500 with a distribution network of a total length of 24km and 1,214 connections in the residential area. The results determined that a total of 1.5 per cent of the supply was lost due to leakage, at 5.2 litres leaked per connection per day.
The second calculations were done in Diemen-Noord, a town close to Amsterdam, with 11km of mains in its distribution network and 2,833 house connections. Here, leakage was determined to be equal to, or less than, 1.6 per cent, with roughly 5.9 litres lost per connection per day.
Please login or Register to leave a comment.